
2017/08/24 Commentary: Trump Troika
© 2017 ROHR International, Inc. All International rights reserved.
Extended Trend Assessments reserved for Gold and Platinum Subscribers
Commentary: Thursday, August 24, 2017
Trump Troika
The ‘Troika’of factors that weighed on US equities and the US dollar and bolstered the govvies remain in place. Yet after the extended problems of the US President due to his various actions regarding the Charlottesville protest, the lack of progress on the tax reform and infrastructure spending aspects of his legislative agenda and the still less than credible approach to the situation with North Korea (NOKO), he now owns various problems through self-inflicted wounds. As such, it is now the ‘Trump Troika’.
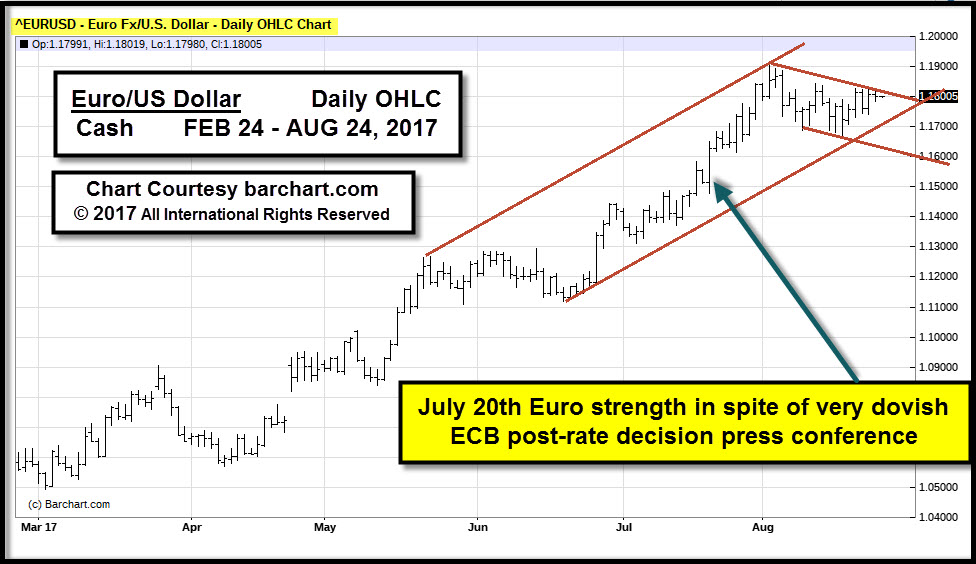
So why would we open a review of how those various factors combine to impede the US economy’s progress toward greater growth with a chart of the Euro versus the US Dollar? Quite simply because it is a good measure of how US prospects have been fading since the early enthusiasm for the Trump administration. While it has been most evident against the euro on EUR/USD strengthened from a 1.0340 January low to current levels, the greenback has also weakened against all other currencies, including emerging currencies for the first time in years. And key investors are losing faith in the ‘Trump trade’…
Authorized Silver and Sterling Subscribers click ‘Read more…’ (below) to access the balance of the opening discussion. Non-subscribers click the top menu Subscription Echelons & Fees tab to review your options. Authorized Gold and Platinum Subscribers click ‘Read more…’ (below) to also access the Extended Trend Assessment as well.


2017/08/31 Commentary: When It Rains…
2017/08/31 Commentary: When It Rains…
© 2017 ROHR International, Inc. All International rights reserved.
Extended Trend Assessments reserved for Gold and Platinum Subscribers
Commentary: Thursday, August 31, 2017
When It Rains…
In fact, the US National Weather Service had to upgrade the color coding on its maps of actual and predicted rainfall amounts. As it noted on Monday, “We've had to update the color charts on our precipitation graphics in order to effectively map [Tropical Storm Harvey]." It added that the new scale “…resets that dark purple color to denote 15-20 inches of rain — and tacks on two more lighter shades of purple to denote 20-30 inches and greater than 30 inches." It is important to keep in mind those are for daily rainfall, and cumulative totals in Houston reached a record of over 50 inches.
Yet market responses are not necessarily consistent between asset classes, especially on the US equities taking the long view of Hurricane Harvey’s impact as it evolved into a sustained tropical storm. They seem to reflect the likely economic strength to follow on a major rebuilding effort. Yet that has not weighed very much on govvies, which seem to be more so discounting the likelihood of near term economic weakness on the struggle to rebound from damage to a significant portion of the fourth largest US city. While the US dollar recovery seemed to reflect economic strength from major rebuilding, late week it is fizzling into nothing more than a bounce from key support (more below.)
Authorized Silver and Sterling Subscribers click ‘Read more…’ (below) to access the balance of the opening discussion. Non-subscribers click the top menu Subscription Echelons & Fees tab to review your options. Authorized Gold and Platinum Subscribers click ‘Read more…’ (below) to also access the Extended Trend Assessment as well.
Read more...