Rohr International's Blog ...evolved capital markets insights

Informed observations on international capital markets & global politico-economics ...with extended ideas on major market trend implications

  • Required Reading Risk Disclaimer
  • About Rohr
  • Subscription Echelons & Fees
  • Tours
  • Contact Us
  • Required Reading Risk Disclaimer
  • About Rohr
  • Subscription Echelons & Fees
  • Tours
  • Contact Us

2016/01/15 TrendView VIDEO: Foreign Exchange (weekend)

January 16, 2016 Rohr-Blog Leave a comment

2016/01/15 TrendView VIDEO: Foreign Exchange (weekend)

© 2016 ROHR International, Inc. All International rights reserved.

The analysis videos are reserved for Gold and Platinum Subscribers

TrendView VIDEO ANALYSIS & OUTLOOK: Friday, January 15, 2016 (weekend)

160115_GBP_FX_WKNDGlobal View: Foreign Exchange

While not quite as wild and wooly as the equities, foreign exchange has had its aggressive movements in select individual currencies. In fact, in terms of breaking various historic technical thresholds, some of the foreign exchange movement has been as impressive as the global stock markets (even if quite a bit less volatile.) Of course, some of the drivers for the more extensive price adjustments in the foreign exchange market are very much the same as the influences weighing on the equities of late. Obviously those include the weakness of energy and commodity prices. Most of the conversation of late has been about the weakness in Crude Oil due to the particular risks associated with its decline.

Much less topical yet no less indicative of the global economic and manufacturing weakness is the extended selloff in Copper. While so many analysts are enthusiastic about the recovery in US home building, little attention has been paid to this serial price decline that speaks of a much weaker conditions for the global housing industry and manufacturing sector. It is not yet anywhere near its 1.2500 December 2008 low while Crude Oil knocks out its equivalent 32.40 low. Yet front month Copper futures dropping back below 2.0000 have violated quite a bit of psychological and technical support from back up in the 2.1500 range and below. Why all of this focus on an industrial metal and energy market trends in the discussion of foreign exchange?

Simple. Even beyond the energy prices impact on the oil exporters, industrial metals are an important component of many of the global economies. As such, reduced receipts for commodities exports are very significant influence on their economic fortunes, and a direct influence on the perceived value of their currencies. No secrets here that the accelerated selloffs in both energy and industrial metals in late 2014 that re-accelerated out of last summer are significant influences. Simply take a look at the commensurate trends in the Australian and Canadian dollars, and the emerging market currencies.

_____________________________________________________________

Video Timeline: It begins with macro (i.e. fundamental influences) mention of the return to weaker data overall that was very apparent in the Bank of England holding the base rate steady at the 0.50% all-time low Thursday and the Fed’s Bullard raising issues about the path of inflation that relates to the discussion above. However, as we discussed the more extensive macro influences in the complementary Global View: Equities & Fixed Income TrendView video analysis post from this weekend, we refer you to that for further details.

It moves on to the US DOLLAR INDEX at 01:30, EUROPE at 04:00 and ASIA at 07:30, followed by the very active CROSS RATES at 09:15 to complete the full review.

_____________________________________________________________

Authorized Gold and Platinum Subscribers click ‘Read more…’ (below) to access the balance of the opening discussion and TrendView Video Analysis and General Update. Silver and Sterling Subscribers click ‘Read more…’ (below) to access the balance of the opening discussion.

Read more...

Rohr Market Research Tagged 2007, 2007 redux, 2016, analysis, Asia, Australia, BoE, BoJ, bond, China, comments, Composite Leading Indicators, confluence, crude, Crude Oil, currency, Deflation, Disinflation, dollar, Draghi, ECB, economic, Empire, employment, Euro, Europe, exports, Fed, fixed income, FOMC, Foreign Exchange, GDP, Germany, Indicators, inflation, instability, Inventories, Japan, macro, macro-technical, Manufacturing, Michigan, normalcy, normalcy bias, normalize, OECD, oil, Pound, PPI, QE, redux, Retail Sales, risk-off, risk-on, S&P 500, Services, T-note, technical, Trade, TREND, UK, US dollar, Yen

2016/01/15 TrendView VIDEO: Concise Highlights (early)

January 15, 2016 Rohr-Blog Leave a comment

2016/01/15 TrendView VIDEO: Concise Highlights (early)

© 2016 ROHR International, Inc. All International rights reserved.

The analysis videos are reserved for Gold and Platinum Subscribers

TrendView VIDEO ANALYSIS & OUTLOOK: Friday, January 15, 2016 (early)

160115_SPZ_CONCISE_0630Concise Highlights

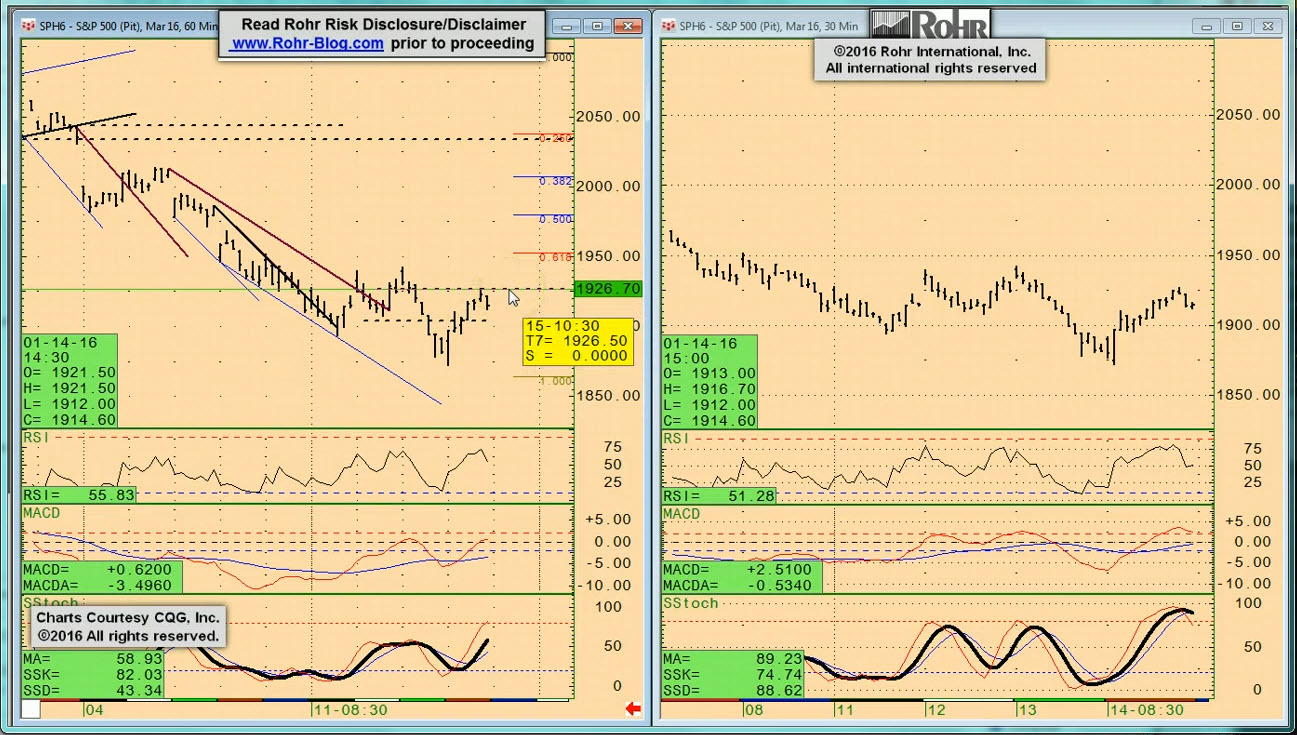
A wild finish to a wild week… well, actually two weeks. Yet this is not a huge surprise after the very weak start to 2016 last week. And rather than becoming more subdued after a sizable correction, the US equities and other markets are entering an even more critical phase into the long US Martin Luther King Day holiday weekend closure Monday. This is going to intensify today’s end of week decision right as the March S&P 500 future plops back down near the next critical major support after Thursday’s sharp recovery.

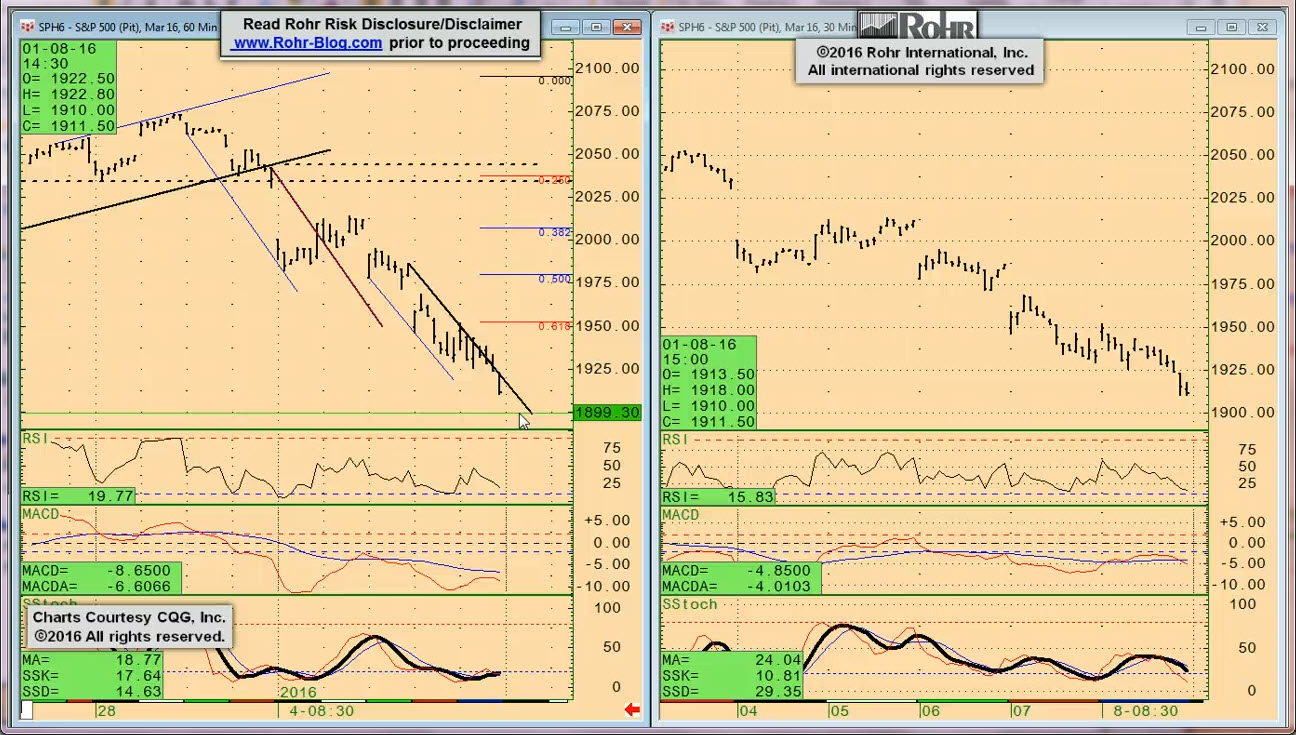
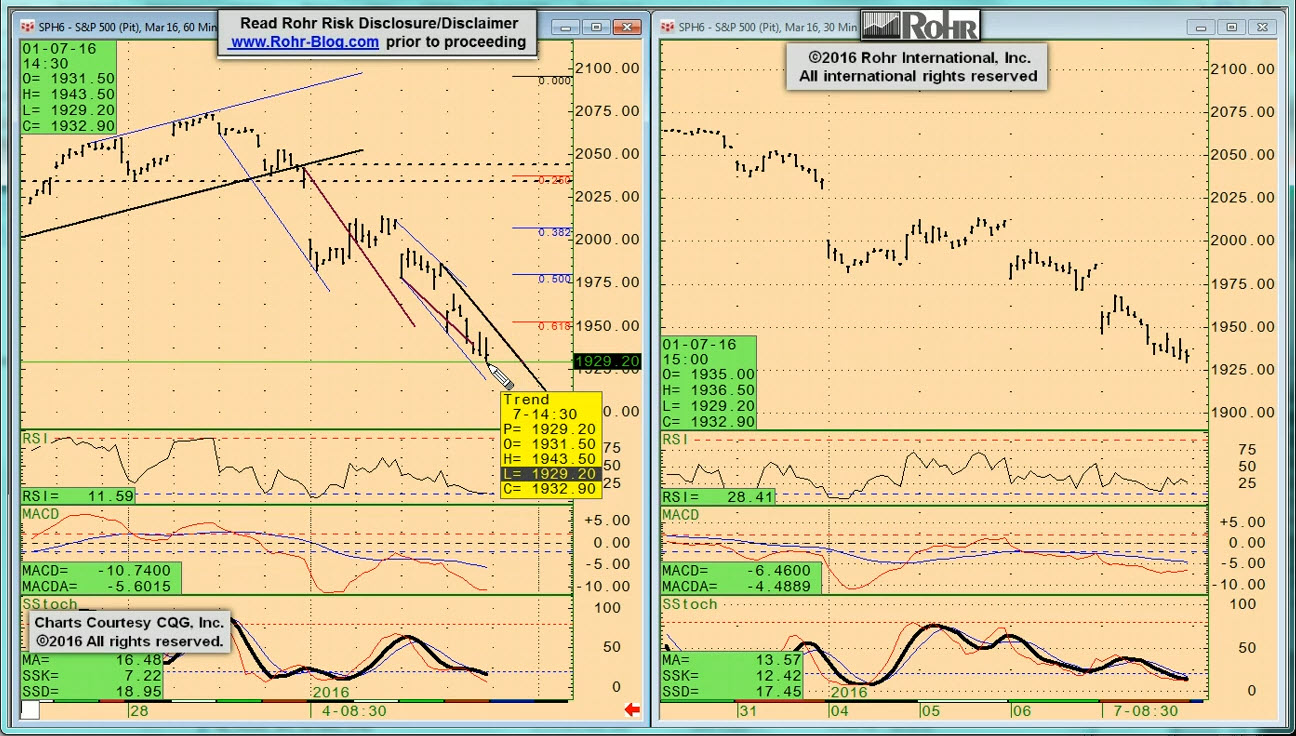
To cut right to the key market activity after yesterday’s Meltdown Time? Redux post revisited the negative economic background, March S&P 500 future starting the year gapping below the major 2,020-10 range was already a very negative sign.

Then last week Thursday morning’s gap below the far more critical (late 2014 into early February 2015) lower 1,975-70 congestion and failure to recover back above that area on the early bounce left it very weak. That was due to each of the previous slides below that area (both in August and September) saw further weakness below interim supports in the 1,960 and 1,930 areas. That indicated a selloff into (and in some cases well below) the 1,900 area was likely. And that is just what transpired. However, there is one more technical threshold that will likely indicate whether or not the equities are in a complete meltdown, or can possibly at least stabilize for an upside reaction. That is the lower major 1,865-60 support. The importance of that area is reviewed in the video from 07:00. For any of you who have not reviewed that in the previous video analysis, we suggest a look.

_____________________________________________________________

Video Timeline: It begins with macro (i.e. fundamental influences) mention of the return to weaker data overall that was very apparent in the Bank of England holding the base rate steady at the 0.50% all-time low on Thursday and also indicating it was not interested in following the Fed’s rate hike lead. That was reinforced by Friday morning’s weak UK Construction Output and Chinese New Yuan Loans, even if overall Chinese lending levels were up, as was the Australian loan picture as we head into a lot of US data today.

It moves on to S&P 500 FUTURE short-term view at 02:00 and intermediate term at 05:30 with a view of the very long term trend on the monthly chart at 07:00, and then only mention of OTHER EQUITIES from 09:00 and GOVVIES from 10:00 including the BUND at 10:45, and only mention of SHORT MONEY FORWARDS from 11:15. Foreign exchange is also only mentioned, with US DOLLAR INDEX at 11:45, Europe at 12:00, ASIA at 12:45 and CROSS RATES active on the weakness of the pound and Australian dollar at 13:45 prior to returning to the S&P 500 FUTURE short term view at 15:00.

_____________________________________________________________

Authorized Gold and Platinum Subscribers click ‘Read more…’ (below) to access the balance of the opening discussion and TrendView Video Analysis and General Update. Silver and Sterling Subscribers click ‘Read more…’ (below) to access the balance of the opening discussion.

Read more...

Rohr Market Research Tagged 2007, 2007 redux, 2016, analysis, Asia, Australia, BoE, BoJ, bond, Bund, China, comments, Composite Leading Indicators, confluence, crude, Crude Oil, currency, DAX, debt, Deflation, Disinflation, dollar, Draghi, ECB, economic, Empire, employment, equities, Euro, Europe, exports, Fed, fixed income, FOMC, Foreign Exchange, FTSE, GDP, Germany, Gilt, govvies, Indicators, Industrial, industrial production, inflation, instability, interest, interest rate, Inventories, Japan, macro, macro-technical, Manufacturing, Michigan, NIKKEI, normalcy, normalcy bias, normalize, OECD, oil, Pound, PPI, QE, redux, Retail Sales, risk-off, risk-on, S&P 500, Services, T-note, technical, Trade, TREND, UK, US dollar, Yen

2016/01/14 Commentary: Meltdown Time? Redux (early)

January 14, 2016 Rohr-Blog Leave a comment

2016/01/14 Commentary: Meltdown Time? Redux (early)

© 2016 ROHR International, Inc. All International rights reserved.

Extended Trend Assessments reserved for Gold and Platinum Subscribers

COMMENTARY (Non-Video): Thursday, January 14, 2016

LargeDOWNarrowPLAIN-REDMeltdown Time? Redux    

Since our Meltdown Time? post exactly one week ago it seems as if that was indeed the major result of all the negative factors noted throughout last year and intensifying since late summer. While the selloff has been both immediate and vicious, we had also noted in the late-November Santa’s Back!! that once the seasonal portfolio manager window dressing was over at the end of last year we remained very skeptical of the economic outlook and equities into this year.

Even allowing that we had no more insight than anyone else on the degree to which the bearish tendencies would be so aggressive right from the top of the year, the immediate technical breakdowns signaled the likelihood of further weakness right from the US opening on January 4th. [See last week Monday’s Commentary: Special alert (early).]

▪ As we already reviewed so much of the background last week, we refer you to all of that rather than replicate it here. There is a brief bit of further reinforcement for the negative outlook we maintain for 2016 (especially the first half of the year), after which we will proceed with a brief assessment of the critical trend condition of the equities.

▪ The bottom line is that as far and as fast as the US equities have dropped the first part of this year, whether they will now enter an extended meltdown phase will likely be determined very soon. That will depend on what transpires late this week into next at the critical lower major support they are now nearing. That will of course be a significant direct influence on the other global equities, and meaningful counterpoint for the fixed income markets (at least in the current phase.)

Authorized Silver and Sterling Subscribers click ‘Read more…’ (below) to access the balance of the opening discussion. Non-subscribers click the top menu Subscription Echelons & Fees tab to review your options and join us. Authorized Gold and Platinum Subscribers click ‘Read more…’ (below) to also access the extended trend assessment as well.

Read more...

Rohr Market Research Tagged 2007, 2007 redux, 2016, analysis, Bernstein, China, economic, employment, equities, Fed, FOMC, Grant, hike, international, macro, macro-technical, meltdown, normalcy, normalcy bias, redux, S&P 500, technical, TREND

2016/01/08 TrendView VIDEO: Global View (weekend)

January 11, 2016 Rohr-Blog Leave a comment

2016/01/08 TrendView VIDEO: Global View (weekend)

© 2016 ROHR International, Inc. All International rights reserved.

The analysis videos are reserved for Gold and Platinum Subscribers

TrendView VIDEO ANALYSIS & OUTLOOK: Friday, January 8, 2016 (weekend)

160108_SPH_GLOBAL_WKNDGlobal View: All Markets  

After a rather active week in the equities with further critical trend potentials looming into next week, it seemed important to develop further analysis after the dust settled on Friday. While it might also seem easy to remain overtly bearish, the rather extensive slide has left the US equities nearing (yet not quite really near) more critical lower support. Rather than leave any suspense or engage in more extensive background on the reasons for the selloff than we have already provided, the March S&P 500 future dropping below 1,960 and 1,930 interim supports after gapping below 1,975-70 is nearing 1,900. Yet on recent form that is also somewhat of an interim area, with the more major support down into the 1,865-60 area. This is not just a random focus on the late-September selloff low.

In addition to that somewhat interesting holding action on the sharp decline after the mid-September failure into the FOMC meeting, it has been a significant Fibonacci retracement level ever since the failure from the 2,130 minor new high (now the all-time lead contract futures high) back in May. While it was washed out during the very sharp late August Chinese currency turmoil, it is once again at least as critical as back in late September. That is due to it being the proximate support of the major weekly up channel from the major 2009 cyclical low in the 666 area. That’s an impressively long up trend.

As with all of these major trend supports, it is so important that a bit of Tolerance must be allowed below. There is actually some further congestion support below based on sharp selloff trading lows at 1,813 on the October 2014 Ebola scare and the 1,831 low from last August’s Chinese currency disruption. However, if there is any weakness below 1,865-60, it will need to be reversed timely to prevent a far more extensive selloff. And after the downside momentum into the end of the week, this seemed worth expressing prior to the opening Monday to ensure the critical lower technical support was clear.

_____________________________________________________________

Video Timeline: It begins with macro (i.e. fundamental influences) mention of weakening of key data, and the unseemly poor equities response to what was perceived to be a very strong US Employment report. However, that was accompanied once again by weak Hourly Earnings and followed by abysmal Wholesale Inventories. And Monday brings the next round of OECD Composite Leading Indicators that have been more downbeat of late.   

It moves on to S&P 500 FUTURE short-term at 02:30 and intermediate term view at 05:30 with a view of the very long term trend on the monthly chart at 08:45, then OTHER EQUITIES from 10:45, GOVVIES beginning at 14:15 (with the BUND FUTURE at 16:15) and SHORT MONEY FORWARDS from 18:45. FOREIGN EXCHANGE covers the US DOLLAR INDEX at 20:30, EUROPE at 22:00 and ASIA at 24:15, followed by the CROSS RATES at 26:00 and a return to S&P 500 FUTURE short term view at 29:00. We suggest using the timeline cursor to access the analysis most relevant for you.

_____________________________________________________________

Authorized Gold and Platinum Subscribers click ‘Read more…’ (below) to access the balance of the opening discussion and TrendView Video Analysis and General Update. Silver and Sterling Subscribers click ‘Read more…’ (below) to access the balance of the opening discussion.

Read more...

Rohr Market Research Tagged 2007, 2007 redux, 2016, analysis, Asia, Australia, BoE, BoJ, bond, Bund, China, Commentary, comments, Composite Leading Indicators, confluence, CPI, crude, Crude Oil, currency, DAX, debt, Deflation, Disinflation, dollar, Draghi, ECB, economic, employment, equities, Euro, Europe, exports, Fed, fixed income, FOMC, Foreign Exchange, FTSE, GDP, Germany, Gilt, govvies, Indicators, inflation, instability, interest, interest rate, Iran, Japan, macro, macro-technical, Manufacturing, Middle East, minutes, NIKKEI, normalcy, normalcy bias, normalize, OECD, oil, Pound, PPI, QE, redux, Retail Sales, risk-off, risk-on, S&P 500, Saudi, Saudi Arabia, Services, T-note, technical, Trade, TREND, UK, US dollar, Wholesale Sales, Yellen, Yen

2016/01/08 TrendView VIDEO: Concise Highlights (early)

January 8, 2016 Rohr-Blog Leave a comment

2016/01/08 TrendView VIDEO: Concise Highlights (early)

© 2016 ROHR International, Inc. All International rights reserved.

The analysis videos are reserved for Gold and Platinum Subscribers

TrendView VIDEO ANALYSIS & OUTLOOK: Friday, January 8, 2016 (early)

160108_SPZ_CONCISE_0630Concise Highlights

As the Chinese equities stabilized this morning after a very tumultuous week that saw two full trading halts, the other equities seemed to have stabilized as well. Yet the weakness of the global equities and strength of the primary government bond markets was due to quite a bit more than just the weakness out of China. We have spent a good deal of this week reviewing all of that, and refer you back to Thursday’s Commentary: Meltdown Time? post for a full summary of the other factors in addition to the Chinese economic and market weakness that has been plaguing the other equities; and will likely continue to do so into at least the first half of 2016. The fact is that the equities failures on rallies going back as far as last May have been a sign the ‘tail risk’ has been increasing, and now is here.

Along with that, instead of reviewing any further macro background we will move directly to a brief technical discussion of the key markets that are likely calling the tune for the other instruments in their asset class. And we begin, of course, with the March S&P 500 future that started the week gapping below the major 2,020-10 range. And Thursday morning it also gapped below the far more critical (late 2014 into early February 2015) lower 1,975-70 congestion. The failure to recover back above that area on Thursday’s early bounce leaves it weak. While we have noted the further interim support into the 1,960 and 1,930 areas, each of the previous slides below 1,975-70 area (both in August and September) saw further weakness into (and in some cases well below) the 1,900 area. Yet if it holds and manages to push back above 1,975-70, the relief rally could also see it back above the 2,020-10 range, up into the higher levels noted above once again.

_____________________________________________________________

Video Timeline: It begins with macro (i.e. fundamental influences) mention of the return to weaker data overall that was very apparent in global PMI’s (both manufacturing on Monday and Services on Wednesday), with the notable exception of Japan. That might explain part of the yen’s haven bid as other currencies weaken against the US dollar. There is also the weakness of the European data this week, with both Euro-zone and German Retail Sales on Thursday as we head into this morning’s US Employment report.

It moves on to S&P 500 FUTURE short-term view at 03:00 and intermediate term at 05:30, with only mention of OTHER EQUITIES from 08:00 and GOVVIES from 08:45 including the BUND at 09:15, and only mention of SHORT MONEY FORWARDS from 09:45. Foreign exchange is also only mentioned, with US DOLLAR INDEX at 10:00, Europe at 10:45, ASIA at 11:30 and CROSS RATES mostly steady with the euro reacting a bit after its recent rally at 12:00 prior to returning to the S&P 500 FUTURE short term view at 12:30.

_____________________________________________________________

Authorized Gold and Platinum Subscribers click ‘Read more…’ (below) to access the balance of the opening discussion and TrendView Video Analysis and General Update. Silver and Sterling Subscribers click ‘Read more…’ (below) to access the balance of the opening discussion.

Read more...

Rohr Market Research Tagged 2007, 2007 redux, 2016, analysis, Asia, Australia, BoE, BoJ, bond, Bund, China, Commentary, comments, Composite Leading Indicators, confluence, CPI, crude, Crude Oil, currency, DAX, debt, Deflation, Disinflation, dollar, Draghi, ECB, economic, employment, equities, Euro, Europe, exports, Fed, fixed income, FOMC, Foreign Exchange, FTSE, GDP, Germany, Gilt, govvies, Housing Starts, IFO, Indicators, inflation, instability, interest, interest rate, Iran, Japan, macro, macro-technical, Manufacturing, Middle East, minutes, NIKKEI, normalcy, normalcy bias, normalize, OECD, oil, Philly, Philly Fed, Pound, PPI, QE, redux, Retail Sales, risk-off, risk-on, S&P 500, Saudi, Saudi Arabia, Services, statement, T-note, technical, Trade, TREND, UK, US dollar, Wholesale Sales, Yellen, Yen, ZEW
Older posts
Newer posts →
  • Members Area

    • Sign-up here!
    • Sign-in here!
  • Rohr International Full Website Link

    Rohr's Website

  • Rohr International Overview

    • Alan Rohrbach Bio
    • Technicals are Rosetta Stone… and a ‘Little Secret’ About Rigid Schools
    • Rohr’s ‘Essential’ Macro-Technical Analysis Full Background Video… Benefit from the In-Depth Concept and Major Historic Applied Example
    • ‘Big Fed Cut’ with Phil Flynn at CME, also Biden with both “Meaningless” in the face of COVID-19 Surge
    • NOV 20 ‘Santa Baby!’ Follow-Up with Phil Flynn Post-FOMC (OCT 30) and Still Quite Bullish US Equities
    • Pre-FOMC (OCT 30) Interview at CME with Price Group’s Phil Flynn predicting further US equities rally
    • The ROHR Insight Advantage
    • Prescient Rohr Early 2008 Interview 12th Anniversary Relevant Lookback
  • ROHR FT Split Bond Views Letter

    January 12, 2024 - Strong Differing Bond Views Maybe Just a Sideshow
  • ROHR FT 2007 Déjà Vu Letter

    December 8, 2023 - Late 2023 Bond Market Looking A Lot Like mid-2007
  • ROHR FT ‘Medium’ Driver Letter

    November 27, 2017 - Why 'Medium' in the Electric Age is driving polarization
  • ROHR Financial Times ‘Risk’ Letter

    October 20, 2017 - Key View: Massive 'Tame' Passive Investment a Real Risk
  • Focused Rohr Expertise Centers

    Rohr Benefits, Perspective & Analytics Samples in a Nutshell. Take a Look…
  • Rohr Alert!! Active S&P 500 views

    • Current Rohr Trend Alert!! and Extended S&P 500 Oscillator Levels
    • Rohr Trend Alert!! Archives Available on a 2 Week Delay
  • Rohr Global Research Note

    • Current Rohr Research Note
    • Rohr Research Note Archive – Available on a 2 Week Delay
  • Rohr International Weekly Report & Event Color-Coded Calendar

    • Current Bi-Weekly Calendar
    • Bi-Weekly International Calendar Archives
  • Better Market Ideas from Independent Analysis…

    Advice both Institutional Investors and Highly Active Dealers/Traders want. And that is NOT at all just our view. Take a Look…
  • Blog Echelons Content & Fee Tables

    • Subscription Table with Fees. ‘Contact Us’ for 14-Day Free Trial
  • Rohr Global Services with Fees

    • Rohr Global Services: Basic Blog onto Full Institutional Advisory
  • Media

    • Rohr’s ‘Essential’ Macro-Technical Analysis Full Background Video… Benefit from In-Depth Concept and Major Historic Applied Example
    • Executive Series Topical Q&A with Ceres Limited’s Brian Jenkins
    • Television
    • Radio
    • Print
    • ‘Teachable Moment’ Analysis Videos from key price trend turning points. Some vintage (2013), some current, all relevant insights. (Accessible for Gold and Platinum subscribers only)
    • Rohr’s Macro-Market Daily e-zine with Multifaceted International Perspective and Broad-Based News (click the title to access the paper)
  • Rohr Website Pages

    • ‘New/Old’ Markets Paradigm
    • ROHR: Methodology & Perspectives
    • ROHR Client Testimonials
    • Alan Rohrbach’s LinkedIn Profile (requires LinkedIn membership)
  • Rohr-Blog Post Calendar

    October 2025
    M T W T F S S
     12345
    6789101112
    13141516171819
    20212223242526
    2728293031  
    « Jul    
  • Archives

  • Hottest Rohr-Blog Topics

    analysis Asia Australia BoE BoJ Bund China comments confluence DAX debt dollar Draghi ECB economic employment equities Euro Europe Fed fixed income FOMC Foreign Exchange FTSE GDP Germany Gilt Indicators inflation instability Japan macro macro-technical NIKKEI PMI Pound QE S&P 500 T-note technical TREND UK US dollar Yellen Yen
Copyright © 2011 Rohr International's Blog ...evolved capital markets insights
Top