2014/04/11: TrendView VIDEO: Concise Highlights (early)
© 2014 ROHR International, Inc. All International rights reserved.
The analysis videos are reserved for Gold and Platinum Subscribers
TrendView VIDEO ANALYSIS & OUTLOOK: Friday, April 11, 2014 (early)
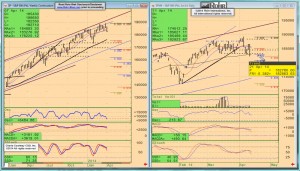
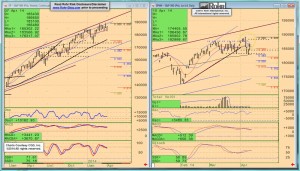
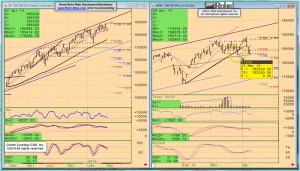
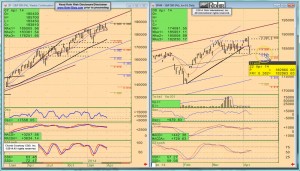
This is a brief follow up to Thursday morning’s extensive Global View, where we extended the implications of last Friday’s analysis of why the June S&P 500 future has likely topped in the intermediate term. Of course, that is also important for all other asset classes. And after retesting and holding the still critical 1,833-28 area of the recent trading lows (that were part of completing the failed Double Top and Rectangle patterns) Tuesday morning, it was ready for the recovery rally we expected. Yet all the while, we still felt the US was leading all the equities into a broader correction, even if classical form still left room to retest the various higher resistances as part of the general topping activity in the June S&P 500 future.
Those included the 1,865-68 most recent short-term DOWN Break and previous hefty congestion it reached in the wake of the still very accommodative FOMC minutes Wednesday afternoon. And even though more prominent resistance awaited at the failed 1,877 Rectangle pattern UP Break (also the old Double Top), in cases where the psychology is getting really stale (maybe on all that weak foreign data Thursday morning) markets can fail at the lowest of their prominent resistances… and that appears to be exactly what happened on Thursday in the US.
Of course, there is now consideration that extensive further slippage below 1,833-28 will leave it as a significant month-and-a-half ‘superstructure’ of resistance above the market. In those cases it is not likely any market holds the near term support, and the June S&P 500 future is not likely an exception. While there is some Fibonacci and minor congestion support at 1,810, it seems more likely this market can see the more major levels into 1,800 or even lower major trend supports. That it has come up so far without a sustained correction since late 2012 leaves it vulnerable to some extensive slippage below 1,800; even if that would only be down to more major bull trend support (more below.)
The video timeline begins with macro (i.e. fundamental influences) discussion of the factors noted above along with the overnight economic data being very limited and as expected on Chinese and German inflation numbers and the Japanese Corporate Service Price Index. And while we will also see US PPI and Preliminary Michigan Sentiment, those are just not the sort of trend-decisive numbers which are likely to reverse the major psychological weakness that is now afflicting equities that have topped in the near term.
It moves on from there to the June S&P 500 future short-term trend view at 02:15 and intermediate-term at 04:55 including all the important pattern and trend implications of the weakness spilling over from yesterday into this morning. Then it’s onto the other equities (mostly responding to the US leadership) at 09:25, followed by discussion of the govvies benefitting modestly from the equities weakness at 15:10 and likewise for the short money forwards at 16:30, and discussion of foreign exchange conforming to yesterday morning’s assessments at 16:40, with a return to the June S&P 500 future at 17:10 for a final view and additional perspective.
[The Weekly Report & Event Calendar and last Friday’s Current Rohr Technical Projections - Key Levels & Select Comments are available via the link in the sidebar]
The TrendView VIDEO ANALYSIS & OUTLOOK is accessible below.
Authorized Gold and Platinum Subscribers Click ‘Read more’ to access TrendView Video Analysis and Brief Update


2014/04/14: TrendView VIDEO: Global View (early)
2014/04/14: TrendView VIDEO: Global View (early)
© 2014 ROHR International, Inc. All International rights reserved.
The analysis videos are reserved for Gold and Platinum Subscribers
TrendView VIDEO ANALYSIS & OUTLOOK: Monday, April 14, 2014 (early)
The extended implications of Thursday’s June S&P 500 future Close below the 1,833-1,828 range confirming the “Equities have topped” perspective from after the previous Friday’s poor US Employment report response was very clear. Further ‘good’ US economic data was not enough to offset the cumulative weak data from elsewhere. Of course, that also included some weaker US data the equities had conveniently ignored on the way up (especially the weaker than expected PMI’s that were reflected in Germany as well, and still weak global trade data… especially China.)
After the week ago Friday failure, we felt the US was leading all the equities into a broader correction, even if classical form still left room to retest the various higher resistances; such as June S&P 500 future 1,865-68 most recent short-term DOWN Break and previous hefty congestion it reached in the wake of the still very accommodative FOMC minutes Wednesday afternoon. Of course, that didn’t stop the psychology from getting so stale again Thursday morning that it dropped below 1,833-1,828 for the US Close. Which made Friday’s further erosion below the previous month-and-a-half trading lows a foregone conclusion if there was no immediate recovery back above 1,833-1,828 instead of the meager test of the low end of the range after Friday’s gap lower opening.
There is now consideration that extensive further slippage below 1,833-28 has left that significant month-and-a-half ‘superstructure’ of resistance above the market. In those cases it is not likely any market holds the near term support, and the June S&P 500 future is not likely an exception. While the Fibonacci and minor congestion support at 1,810, it seems more likely this market can see the more major levels into 1,800 or even lower major trend supports. That it has come up so far without a sustained correction since late 2012 leaves it vulnerable to some extensive slippage below 1,800; even if that would only be down to more major bull trend support (more below.)
The video timeline begins with macro (i.e. fundamental influences) discussion of the factors noted above along with the as expected Euro-zone Industrial Production numbers as we awaited the US Retail Sales figures. In the event, those turned out to be stronger –than- expected, which is assisting a short term equities bounce this morning. Yet with a light reporting day today, it will be more important how markets respond to much more extensive critical releases (including European and Chinese data) from tomorrow onward.
It moves on from that overview to the June S&P 500 future short-term trend view at 01:35 and intermediate-term at 04:30, then the other equities from 07:15, with govvies analysis beginning at 17:25 and short money forwards at 17:00. Foreign exchange begins with the US Dollar Index at 21:00, jumping over to Europe at 22:50 and Asia at 26:00, followed by the cross rates at 30:00, and a return to June S&P 500 future at 34:00 for a final view and additional perspective. As this is an especially extensive analysis due to its assessment of significant near term contingencies in the S&P 500 and govvies, even more so than usual we suggest using the timeline cursor to access the analysis most relevant for you.
[The Weekly Report & Event Calendar is available via the link in the sidebar. The updated Current Rohr Technical Projections - Key Levels & Select Comments will be available after today’s US Close]
The TrendView VIDEO ANALYSIS & OUTLOOK is accessible below.
Authorized Gold and Platinum Subscribers Click ‘Read more’ to access TrendView Video Analysis and General Update
Read more...